Mathematics (New)
COORDINATE GEOMETRY
Reading settings
Text size
Line spacing
Colours
COORDINATE GEOMETRY
In this topic you will learn about Basic concepts of Coordinate Geometry, Gradient(slope) of a line, Equation of a line, Graphing Linear Equations and Solving Simultaneous Equations graphically.
Upon completion of this chapter, you should demonstrate competencies in Reading the coordinates of a point, Locating points on the coordinate plane accurately, Drawing the graph of a given Linear Equation correctly, Drawing and analyzing geometric shapes, Finding the equation of the line given two points on it and Solving linear simultaneous equations graphically correctly.
These competencies should help you solve real life problems especially those involving location of places and maps, surveying and many more.
Introduction
In our daily lives, we often need to describe positions and locations. For example, finding a house using a map, locating a place using GPS coordinates or identifying seats in a hall. Coordinate Geometry helps us do all of these exactly and more correctly.
Therefore, Coordinate Geometry is a branch of mathematics that helps us locate points and draw shapes on a coordinate plane using pair of numbers (points) called Coordinates. These points are plotted on two perpendicular lines called the 𝑥-axis and 𝑦−axis, which together form the Cartesian plane.
Basic Concepts of Coordinate Geometry
Coordinate geometry deals with the study of geometric shapes and figures by representing them using coordinates and equations on a coordinate plane.
The basic Tenets of Coordinate Geometry and Solve the Related Problems
The Coordinate Plane: Locating Points
Explore the basic tenets of coordinate geometry and solve the related problems
Coordinates of a point are the values of x and y normally enclosed in a bracket which are used to describe the position of a point in the plane. A number plane sometimes called( 𝑥𝑦−𝑝𝑙𝑎𝑛𝑒 ) is made up of two number lines which intersect at right angles as shown in the figure 6.1 below.
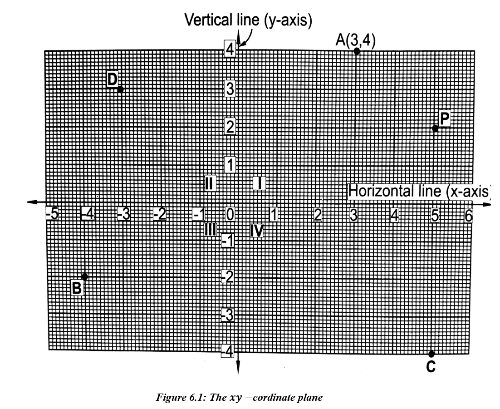
In Cartesian plane, the horizontal line is called the x-axis and the vertical line is the y-axis.
The point at which the two axes intersect is called the origin. The two axes divide the plane into four parts called quadrants, (I, II, Ill and IV), as shown in figure 6.1 above.
The pair of numbers that correspond to point A is (3, 4). In representing a point, the order in which the numbers are written matters as the first number represents a distance from the origin along the x-axis and the second number represent a distance from the origin along the y-axis. This pair is called an ordered pair or coordinates.
NB: Always the first number is for the x-axis and the second for y-axis.
The first number in the ordered pair is called the first coordinate or (abscissa), and the second is called ordinate for example, the coordinates of D, in figure 6.1. are (-3, 3). It has the x-coordinate -3 and y-coordinate 3. The coordinates of the origin are (0, 0).
The word plotting of points is commonly used to mean indicating the points on the Cartesian plane(or 𝑥𝑦−𝑝𝑙𝑎𝑛𝑒).
Example 1
Write the coordinates of points B, C and P indicated in figure 6.1 above;
Solution;
The coordinates of the points B, C and P are 𝐵(−4,−2), 𝐶(5,−4) 𝑎𝑛𝑑 𝑃(5,2).
Example 2
In which quadrants are the points A, B, C and D?
Point A is in the first quadrant
Point B is in the third quadrant
Point C is in the fourth quadrant and
Point D is in the second quadrant.
Exercise 1
1.Draw the 𝑥𝑦−𝑝𝑙𝑎𝑛𝑒 and then plot the points P(3,7), Q(-3, 5), R( -5, -6), S(0,-2), T(4,-7), U(0, 3), V(5,0) and W(-4,0).
2. (a) Write down the coordinates of each of the points indicated in figure 6.2 below, found in the first and third quadrants.
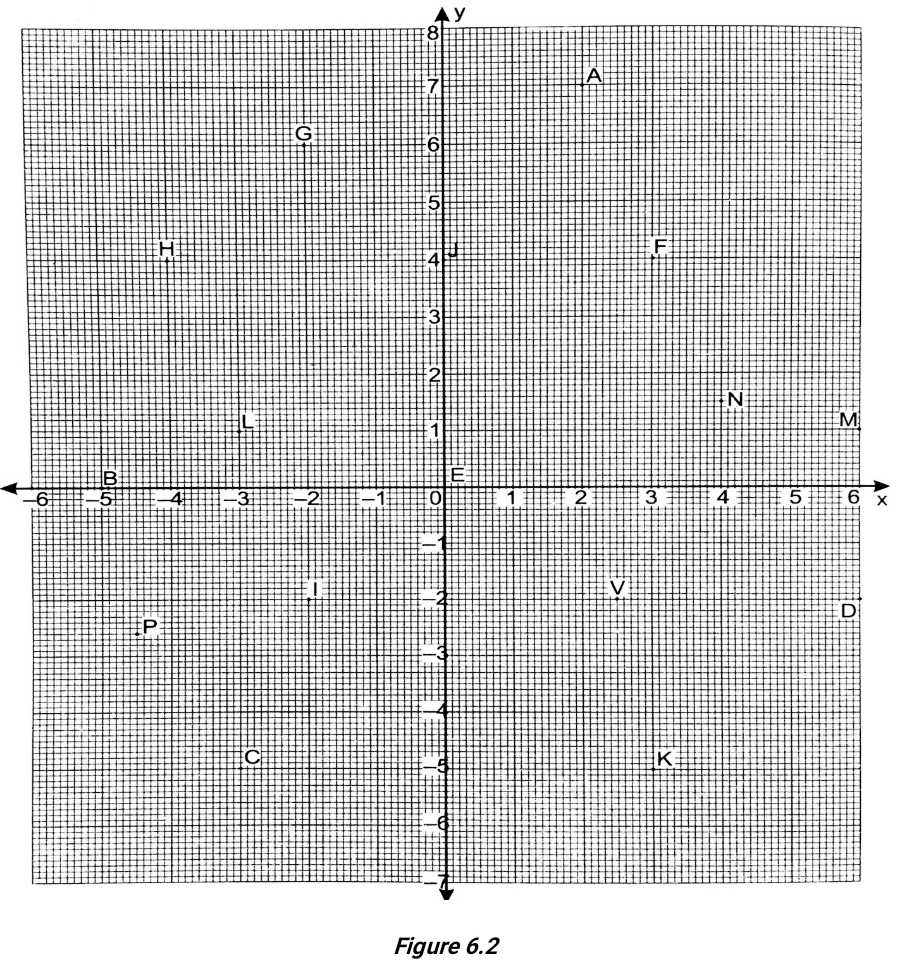
3. State the quadrant in which each of the following points lie; P(3,7), Q(-3, 5), R( -5, -6), S(0,-2), T(4,-7), U(0, 3), V(5,0) and W(-4,0).
Gradient of a Straight Line
Definition; Gradient or slope of a straight line is defined as the measure of its steepness.
The Concept of the Gradient (Slope) of a Straight Line and Solve Related Problems
Gradient: The Steepness of a Line
Explain the Concept of the Gradient (Slope) of a Straight Line and Solve Related Problems
Consider a line joining two points A and B as shown in figure 6.3, and a body moving from A to B, by first going horizontally to P and then vertically to B.
The length AP is the change in 𝑥 and it is positive because the motion is to the right from the origin. The length PB is the change in y and it is also positive because the motion is upwards.
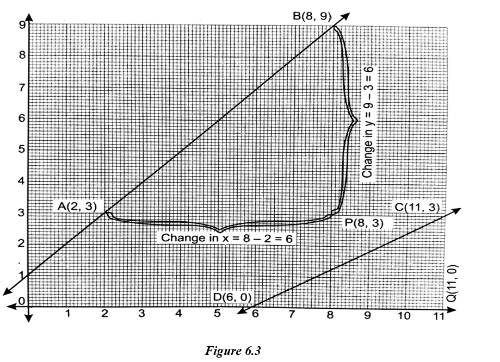
The number (𝑐ℎ𝑎𝑛𝑔𝑒 𝑖𝑛 𝑦) divided by (𝑐ℎ𝑎𝑛𝑔𝑒 𝑖𝑛 𝑥) is what we call the gradient of the line AB, which is in this case (9-3)/(8-2) = 6÷6=1. The gradient is also called the slope of the line, and it is denoted by the letter 𝑚.
If follows that, if we consider 𝐴(𝑥1,𝑦1) and 𝐵(𝑥2,𝑦2) as arbitrary points (any points) joined by the straight line, then the Change in y is 𝑦2−𝑦1 and change in x is 𝑥2−𝑥1.

Example 3
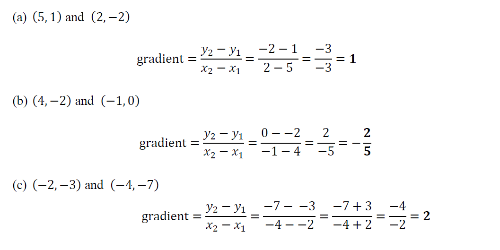
Find the gradient of the lines joining;
- (5, 1) and (2,−2)
- (4,-2) and (-1,0)
- (−2,−3) and (−4,−7)
Solution;
Example 4
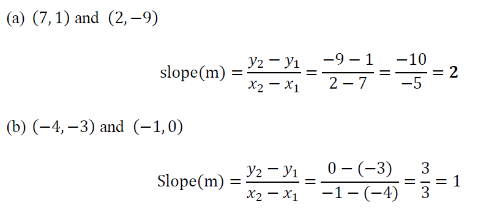
Find the slope of the lines joining the following pairs of points.
- (7, 1) and (2,−9)
- (−4,−3) and (−1, 0)
Solution;
Example 5
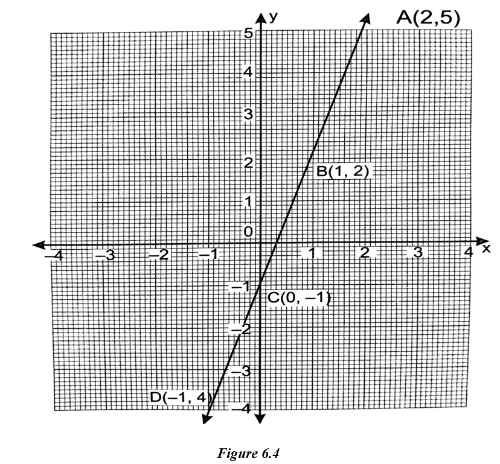
Find the gradients determined by the following pairs of points on the line drawn in figure 6.4:
(a) (2,5) and (-1, -4)
(b) (1, 2) and (0, -1)
(c) (1, 2) and (-1, -4)
(d) (2, 5) and(1, 2)
Solution;
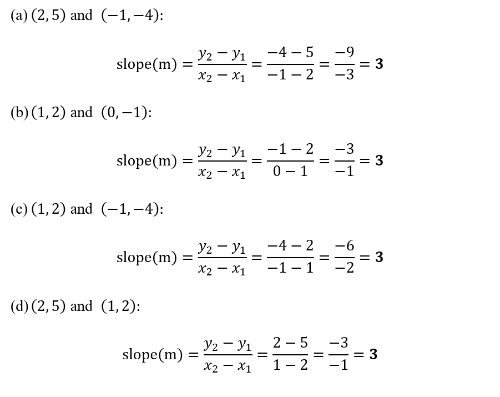
From example 5, we see that the gradient of the line does not change no matter what pair of points are used provided that all the points chosen lie on the same straight line.
Example 6
(a) The line joining (2,−3) and (𝑘,5) has gradient−2. Find the value of 𝑘.
(b) Find the value of 𝑚 if the line joining the points (−5,−3) and (6,𝑚) has a slope of 1/2.
Solution;
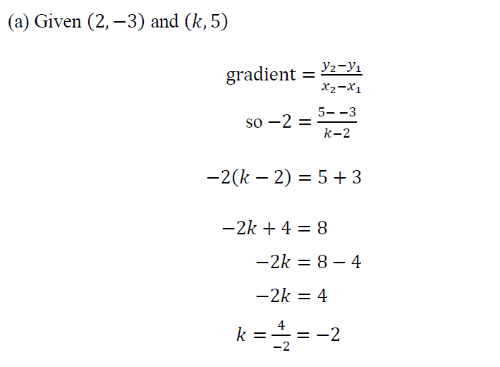
∴ The value of 𝑘 is −2.
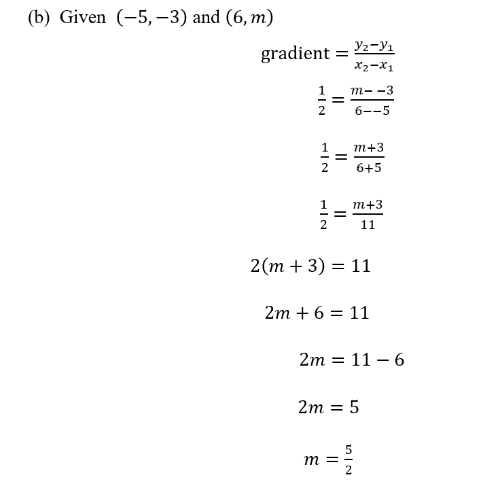
∴ The value of 𝑚 is 5/2.
Generally, you only need two points on the straight line in order to get its slope.
Exercise 2
1. Find the gradients determined by the following pairs of points.
(a) (2,5) and (-8, -4)
(b) (1, 5) and (0, -1)
(c) (1, 7) and (3, -4)
(d) (-2, -3) and (1, 12)
(e) (2,5) and (-1, -4)
(f) (1, 2) and (0, -1)
(g) (-4, -2) and (-1, 7)
(h) (3, -3) and (11, 21)
2. The line joining (2,−8) and (𝑥,6) has gradient 2. Find the value of 𝑥.
3.Find the value of 𝑦 such that the line joining the points (5,−3) and (7, 𝑦) has a slope of 5.
4.Find the value of 𝑘 such that the line joining the points (−2,−3) and (6,𝑘) has a slope of 1.
5. The line joining the points (3, 𝑝 ) and (−𝑝,−1) has gradient 3/4. Find the value of 𝑝.
Equation of a Straight Line
An equation of a straight line is a mathematical expression that shows the relationship between x and y for all points lying on that line on the coordinate plane. Therefore, the equation shows how the two variables (x and y) change together along the straight line within a coordinate plane.
The Basic Idea Behind the Equation of a Straight line and Find the Solutions to the Related Problems.
The Equation of a Straight Line (y = mx + c)
Explore the Basic Idea Behind the Equation of a Straight line and Find the Solutions to the Related Problems.
Consider a straight line through points 𝐴(3,7) and 𝐵(−2,−3) as shown in figure 6.5 below.
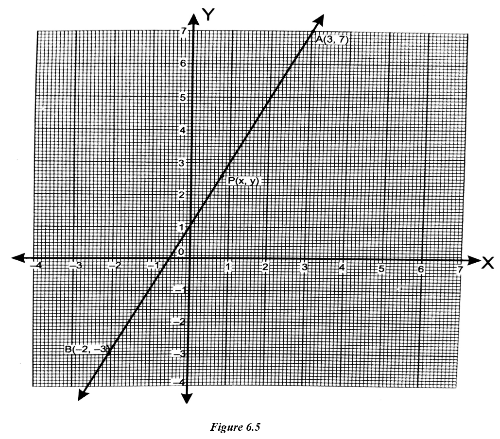
Suppose there is another point P(𝑥,𝑦) which lies on the line AB, then the gradient of this line can be found using either the pair of points A(3,7) and B(−2,−3) or A(3,7) and P(𝑥,𝑦) or B(−2,−3) and P(𝑥,𝑦). In short, we can have the gradient of the line by choosing any two points lying on it.
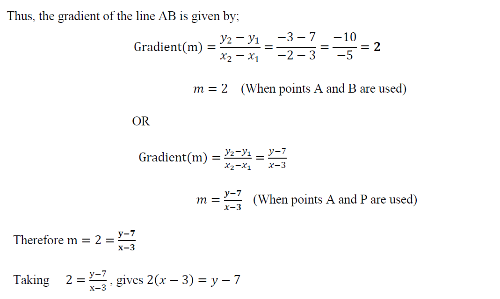
This simplifies to 2𝑥−6 = 𝑦−7 or 𝒚=𝟐𝒙+𝟏, which is the equation of the line passing through AB.
Note that the same equation can be obtained using points B (-2, -3) and P (x, y). The relation 𝑦 = 2𝑥+1, is the equation of the line passing through the points A and B.
The coordinate of the point at which a graph cuts the y-axis is called the y-intercept. In figure 6.5, the y-intercept is 1, because the graph cuts the y-axis at point (0,1).
In any equation, the y-intercept is at 𝑥 = 0, hence the y-intercept for 𝑦=2𝑥+ 1 is 𝑦 = 2×0+1=1.
The Equation of a Straight Line Given Its Gradient and One Point on it
Find the Equation of a Straight Line Given Its Gradient and One Point on it
The equation of a straight line can be obtained when its gradient (𝑚) and a point Q (𝑥1,𝑦1) lying on it are given.

Example 7
Find the equation of the line whose;
(a) Gradient is 2 and lies on the point (2,3).
(b) Gradient is 12 and passes through (−4,6).
(c) Slope is −3 and goes through the point (1,−7).
(d) Slope is −1 and lies on the point (−1,−9).
Solution;
(a) 𝑚=2 and (𝑥1,𝑦1)=(2,3) equivalently, 𝑥1 = 2 and 𝑦1 = 3. But the equation is given by 𝑚(𝑥−𝑥1) = 𝑦−𝑦1,
Substitution of given data yields 2(𝑥−2)= 𝑦−3 which simplifies to 2𝑥−4=𝑦−3 or 𝑦 =2𝑥−1
∴ The equation of the line is 𝑦 = 2𝑥−1
(b) 𝑚=1/2 and (𝑥1,𝑦1)=(−4,6), equivalently 𝑥1=−4 and 𝑦1= 6. But the equation is given by 𝑚(𝑥−𝑥1)=𝑦−𝑦1
Substitution of given data yields (1/2)(𝑥−−4) = 𝑦−6 which simplifies to (1/2)𝑥+2 = 𝑦−6, or 𝑦=𝑥/2+8
∴ The equation of the line is 𝑦 = 𝑥/2 +8.
(c) 𝑚 =−3 and (𝑥1,𝑦1)=(1,−7), equivalently 𝑥1=1 and 𝑦1=−7;
The equation is given by 𝑚(𝑥−𝑥1) = 𝑦−𝑦1 and substitution of given data yields −3(𝑥−1)= 𝑦−−7 which simplifies to −3𝑥+3 = 𝑦+7 or 𝑦=−3𝑥−4.
∴ The equation of the line is 𝑦 =−3𝑥−4.
(d) 𝑚=−1 and (𝑥1,𝑦1)=(−1,−9), equivalently 𝑥1=−1 and 𝑦1=−9.
The equation is given by 𝑚(𝑥−𝑥1) = 𝑦−𝑦1, substituting the given data yields −1(𝑥−−1) = 𝑦−−9 which simplifies to −𝑥+−1 = 𝑦+9 or 𝑦 =−𝑥−10.
∴ The equation of the line is 𝑦 =−𝑥−10.
Exercise 3
1. Find the equations of the lines which passing through the following pair of points;
(a) (3,5) and (8,7)
(b) (4,0) and (0,11)
(c) (−0.5,0.8) and (1, 7)
2. Find the equation of the line with;
(a) Gradient 4 and y-intercept 8
(b) Gradient −2 and y-intercept 7
(c) Gradient 3 and x-intercept −1
(d) Gradient −1 and x-intercept 3
3.Find the equation of the line with the following given information:
(a) Gradient 2 and passing through the point (3,9)
(b) Gradient −2/3 and passing through the point (2,4)
(c) Gradient 2 and passing through the point (−3,−9)
(d) Gradient −7 and passing through the point (0,5)
(e) Gradient 1 and passing through the origin.
General Equation of a Straight Line
An equation of a straight line can be expressed in different forms without changing its meaning, for example the same equation can be written by expressing x in terms of y and constants or by expressing y in terms terms of x and constants. However, some equation forms are useful in simplifying some mathematical problem solving.
The Concept of General Equation of the Straight line and Write the Linear Equations in the General Form, that is ax+by+c=0 and y=mx+c
Explain the Concept of General Equation of the Straight line and Write the Linear Equations in the General Form, that is ax+by+c=0 and y=mx+c
In general, the equation of a straight line can be expressed as 𝑦 = 𝑚𝑥+𝑐, where 𝑚 represents the gradient (or slope) of the line and 𝑐 denotes the 𝑦-intercept. This form is commonly known as the Slope–Intercept Form.
Alternatively, the equation of a straight line may be written as 𝑎𝑥+𝑏𝑦+𝑐 = 0, where 𝑎 and 𝑏 are the coefficients of 𝑥 and 𝑦 respectively. This form is referred to as the General Equation Form of a straight line.
Example 8
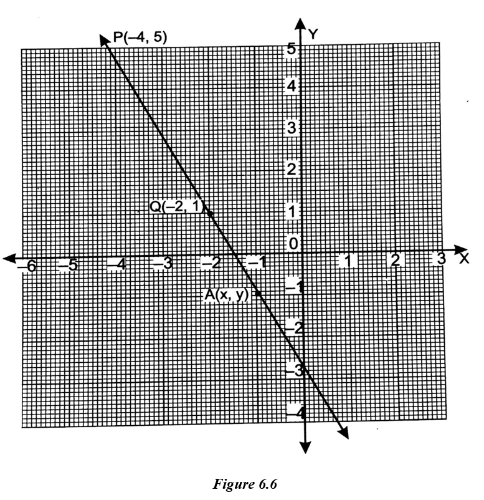
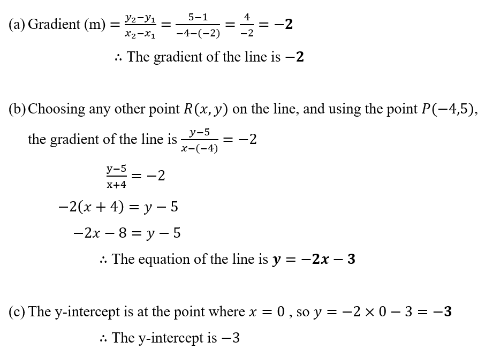
Consider the straight line on a graph paper through points 𝑃(−4,5) and 𝑄(−2,1) as shown in figure 6.6, then find:
(a) The slope of the line
(b) The equation of the line
(c) The y-intercept
Solution;
Example 9
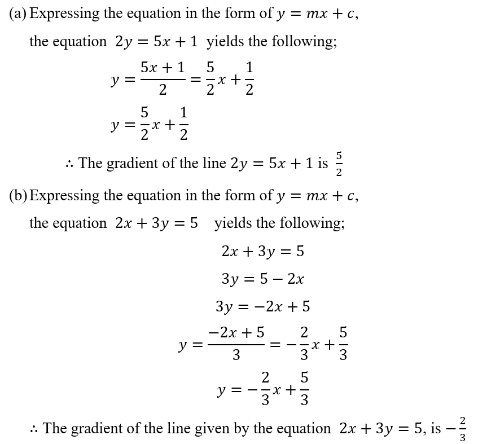
Find the gradient of each of the following straight lines by expressing them in the form of 𝑦 = 𝑚𝑥+𝑐;
(a) 2𝑦 = 5𝑥+1 (b) 2𝑥+3𝑦 = 5 (c) 𝑥+𝑦 = 3
Solution;
(c) 𝑥+𝑦=3;
Writing the equation in the form of 𝑦 = 𝑚𝑥+𝑐 gives the following;𝑦=3−𝑥 or 𝑦 =−𝑥+3.
∴ The gradient of the straight line given by the equation 𝑥+𝑦 = 3, is −1.
Example 10
Express each of the following equations of straight lines in the form of 𝑎𝑥+𝑏𝑦+𝑐 = 0;
(a) 2𝑦 = 5𝑥+1
(b) 2𝑥+3𝑦 = 5
(c) 𝑥+𝑦 = 3
Solution;
(a): The equation 2𝑦 = 5𝑥+1 is the same as 0=5𝑥+1−2𝑦 or 0 = 5𝑥−2𝑦+1,
∴ The equation in general form is written as 5𝑥−2𝑦+1= 0.
(b): The equation 2𝑥+3𝑦 =5 is the same as 2𝑥+3𝑦−5 = 0,
∴ The equation in general form is written as 2𝑥+3𝑦−5 = 0.
(c): The equation 𝑥+𝑦 = 3 is the same as 𝑥+𝑦−3=0,
∴ The equation in general form is written as 𝑥+𝑦−3 = 0.
Example 11
Find the equation of a straight line in the form of 𝑎𝑥+𝑏𝑦+𝑐 = 0 passing through the following pairs of points.
(a) (2,5) and (-8, -4)
(b) (1, 5) and (0, -1)
Solution;
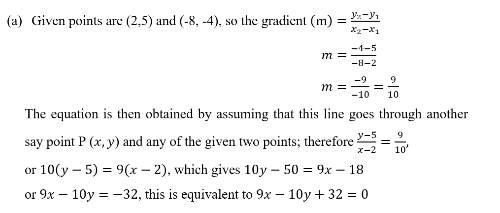
∴ The required equation in general form is 𝟗𝒙−𝟏𝟎𝒚+𝟑𝟐 = 𝟎
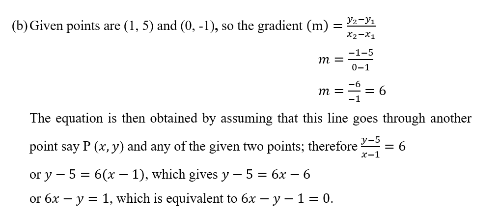
∴ The required equation in general form is 𝟔𝒙−𝒚−𝟏 = 𝟎
Exercise 4
1. Find the equations of the lines which passing through the following pair of points and write them in the form of 𝑎𝑥+𝑏𝑦+𝑐 = 0.
a) (−3,1) and (8,7)
(b) (2,0) and (4,11)
(c) (0.5,−0.25) and (1, 1)
2. Express the following linear equations in form of the genera equation form.
(a) 𝑦 = 3𝑥−6
(b) 2𝑥−𝑦 = 8
(c) 2𝑥 = 4−𝑦
(d) 𝑥 = 𝑦
3. Write the equations of the lines whose information are given in question 1 in the form of 𝑦 = 𝑚𝑥+𝑐.
4. State the gradient and 𝑦−intercept of each of the equations given in question 2 above.
Graphing Linear Equations
The common method used in drawing or sketching graphs of straight lines is by table of values and intercepts.
Graph of Linear Equations Using a Table of Values
Graphing of Linear equations by table of values
In order to graph a straight line, you need to prepare a table showing some points through which the line passes. This is done by choosing some values of one variable (normally starting with x-values) and then for each value of x, you use the equation to find the corresponding value of y, and hence obtaining the ordered pairs presented in the table.
After having a table of values, locate the ordered pairs on the 𝑥𝑦−𝑝𝑙𝑎𝑛𝑒 and then join them straightly.
Note that any two reasonable points through which the line passes are enough for drawing/sketching the graph of the given equation.
Example 12
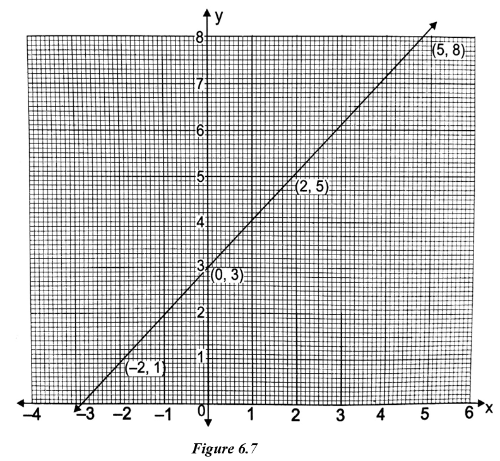
Prepare a table of values corresponding to the equation 𝑦 = 𝑥+3 and then draw its graph.
Solution;
The following table shows some values of x and the corresponding values of y.

The table above shows that when x = -2, y = 1 and when x = 0, y = 3 etc. Therefore, the ordered pairs are (-2, 1), (0,3), (2, 5) and (5, 8).
A graph of 𝑦 =𝑥+3 is shown below:
Example 13
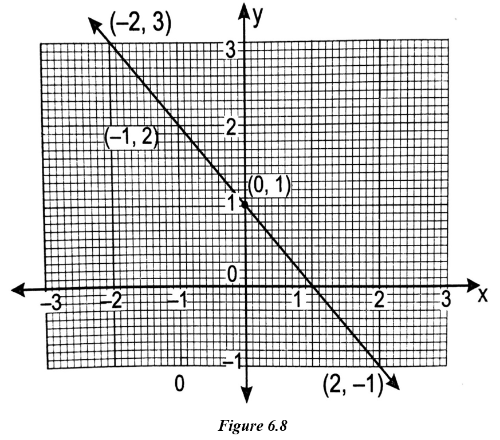
Use a table of values to draw the graph of the line whose equation is 𝑥+𝑦 =1.
Solution;
The equation 𝑥+𝑦 =1 is the same as 𝑦 =1−𝑥 or 𝑦 =−𝑥+1.
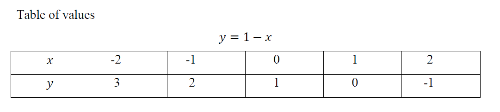
From the table of values, the ordered pairs are (-2,3), (-1,2), (0, 1), (1,0) and (2, -1).
The graph of 𝑥+𝑦 =1 is shown below;
Example 14
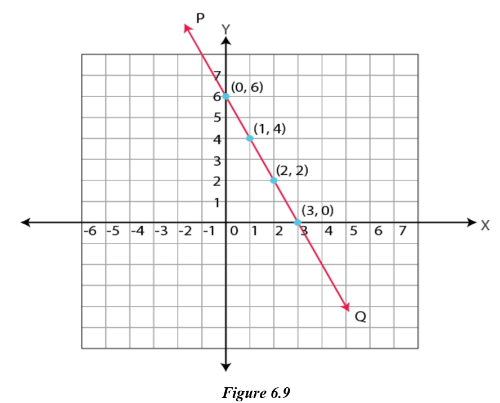
Prepare a table of values for the equation 2𝑥+𝑦-6= 0, and use the values from the table to draw the graph of the line.
Solution;
The equation 2𝑥+𝑦-6 = 0 is the same as 𝑦 = -2𝑥+6.
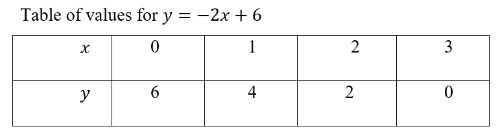
From the table of values, the ordered pairs are (0,6), (1,4), (2,2) and (3,0). The graph of 2𝑥+𝑦-6 = 0 or 𝑦 = -2𝑥+6 is a straight line passing through these points as shown in figure 6.9 below;
Example 15
Use the intercepts of the equation 𝑦 = 2𝑥+2 to sketch its graph.
Solution;
The y-intercept is obtained when x = 0, so 𝑦 = 2×0+2=2 which gives y = 2.
The x-intercept on the other hand is when y = 0, so 0 = 2𝑥+2 or 2𝑥 =-2, which gives 𝑥 =−1.
The intercepts give us two ordered pairs, (0, 2) and (-1, 0). Therefore, the graph is a straight line joining these two points as shown below.
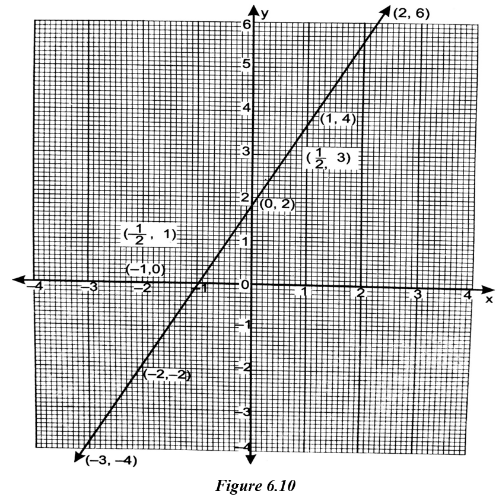
Note that in example 15, the intercepts have been used in sketching the graph but the line passes through uncountable other points.
The Concept of Intercepts (x and y intercepts) of Straight Lines
Explain the Concept of Intercepts (x and y intercepts) of Straight Lines
The line of the form 𝑦 = 𝑚𝑥+𝑐, crosses the 𝑦−𝑎𝑥𝑖𝑠 when 𝑥 = 0 , and it crosses 𝑥−𝑎𝑥𝑖𝑠 when 𝑦 = 0.
Therefore,
(i) To get the 𝑥−intercept, substitute 𝑦 = 0 in the equation and solve for 𝑥.
(ii) To get the 𝑦−intercept, put 𝑥 = 0 in the given equation and solve for 𝑦.
NB: The equation in the form y = mx+c, has 𝑚 as its gradient and c is the y-intercept.
Example 16
Find the 𝑦− intercepts for the following lines;
(a) 𝑦 = 3𝑥+5
(b) 𝑦 =−(1/2)𝑥+2/3
(c) 3𝑦 = 2𝑥+1
Solution;
(a) 𝑦 =3𝑥+5;
By comparing the equation with 𝑦 =𝑚𝑥+𝑐, 𝑦−intercept = c = 5,
∴ The 𝑦−intercept of the line given by the equation 𝑦 = 3𝑥+5, is 5.
(b) 𝑦 =−(1/2)𝑥+2/3 , this equation is in the form of 𝑦 = 𝑚𝑥+𝑐, where c is the 𝑦−intercept,
∴ The 𝑦−intercept of the given equation is 2/3.
(c) 3𝑦 = 2𝑥+1: Expressing this equation in the form of 𝑦 = 𝑚𝑥+𝑐 gives the following;
𝑦 = (2𝑥+1)/3 = (2/3)𝑥+1/3
Now, 𝑦 = (2/3)𝑥+1/3 is in the form of 𝑦 = 𝑚𝑥+𝑐, where m = slope and c = y-intercept.
∴ The 𝑦−intercept of the equation 3𝑦 = 2𝑥+1, is 1/3.
Example 17
Find the 𝑥 and 𝑦− intercepts of the following lines;
(a) 2𝑥−3𝑦−2 =0
(b) 2𝑦−4𝑥+5 = 0
Solution;
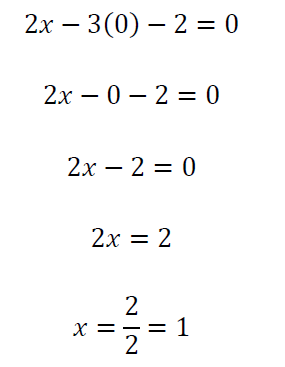
(a): For 𝑥−intercept, let 𝑦 = 0 and solve for x in the equation 2𝑥−3𝑦−2 = 0;
For 𝑦−intercept, let 𝑥 = 0 and solve for y in the equation 2𝑥−3𝑦−2 = 0;
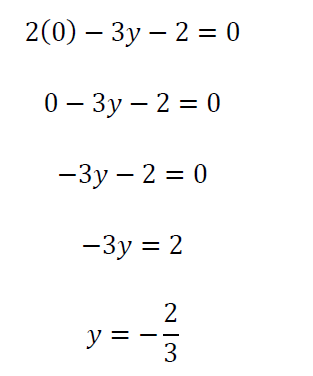
∴ The 𝑥−intercept =1 𝑎𝑛𝑑 𝑦−intercept =−2/3.
(b): 𝑥−intercept, let 𝑦 = 0 and and solve for x in the equation 2𝑦−4𝑥+5 = 0;
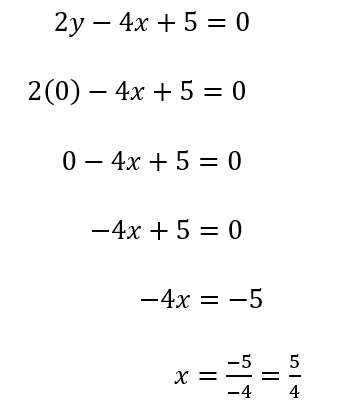
Again for 𝑦−intercept, let 𝑥 = 0 and solve for y in the equation 2𝑦−4𝑥+5 = 0;
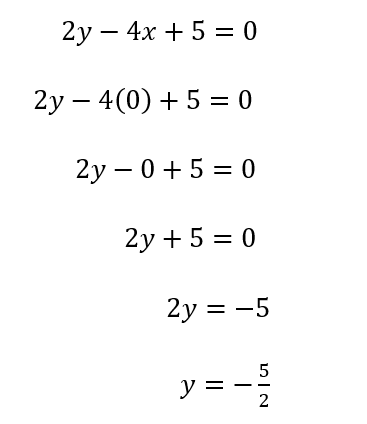
∴ The 𝑥−intercept = 5/4 𝑎𝑛𝑑 𝑦−intercept =−5/2
Graph Linear Equations Using Intercepts
Using Intercepts to Draw a Line
The intercepts show the points on the x-axis and y-axis through which the line passes, if you have them, then to sketch the graph is easy as you only need to join them by a straight line.
Example 18
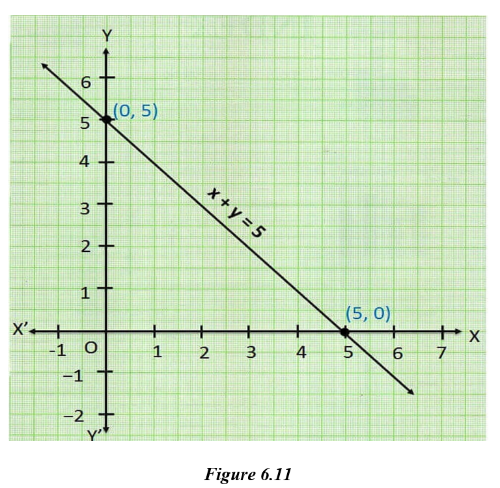
Use the intercepts to draw the graph of the line represented by the equation x+y=5.
Solution;
The equation 𝑥+𝑦 = 5 has the 𝑥−𝑖𝑛𝑡𝑒𝑟𝑐𝑒𝑝𝑡 5, that is when 𝑦 = 0, 𝑥 = 5; also its 𝑦−𝑖𝑛𝑡𝑒𝑟𝑐𝑒𝑝𝑡 is 5, that is when 𝑥 = 0, 𝑦 = 5.
Therefore, the line crosses the 𝑥−𝑎𝑥𝑖𝑠 at the point (5,0) and 𝑦−𝑎𝑥𝑖𝑠 at the point (0,5), and its graph is the line joining these two points as shown in figure 6.11 below:
A graph of the line given by the equation 𝑥+𝑦 = 5:
Example 19
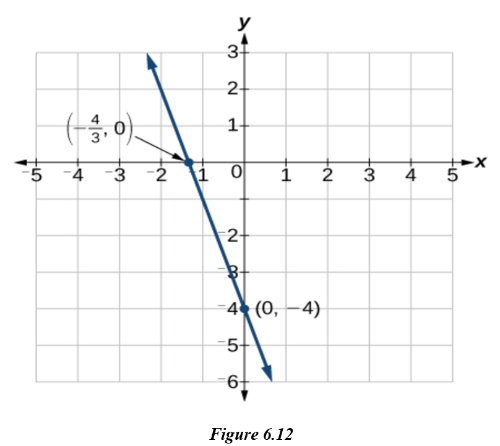
Draw the graph of the line represented by the equation 3𝑥+𝑦+4=0 by using intercepts.
Solution;
From the equation 3𝑥+𝑦+4=0, when 𝑥=0, 𝑦=−4 and when 𝑦 = 0, x=−4/3, therefore the line crosses the 𝑦−𝑎𝑥𝑖𝑠 at the point (0,−4) and the 𝑥−𝑎𝑥𝑖𝑠 at (−4/3, 0) and hence the graph is the straight line joining these two points.
The graph of the line represented by the equation 3𝑥+𝑦+4 = 0 is shown in figure 6.12 below:
Example 20
Use intercepts to draw the graph of the line represented by the equation 𝑦 =(3/4)𝑥−3 .
Solution;
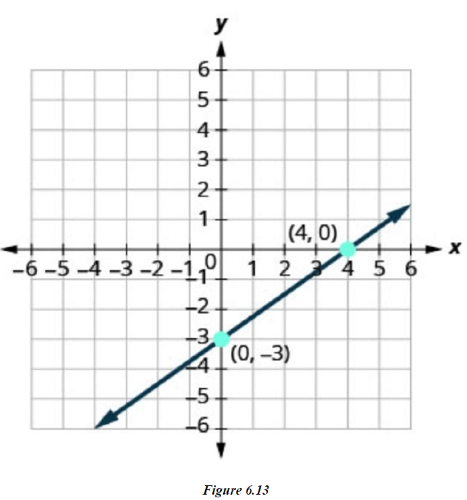
From the equation 𝑦=(3/4)𝑥−3, the 𝑥 and 𝑦 intercept are 4 and −3 respectively, thus the line crosses the 𝑥−axis at the point (4,0) and the 𝑦−axis at the point (0,−3), hence its graph is as shown in figure 6.13 below:
Example 21
Draw the graph of the line with the equation 𝑥+2𝑦 =7 by using intercepts.
Solution;
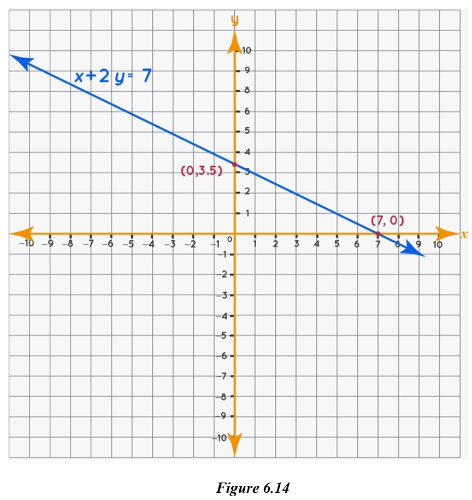
From the equation 𝑥+2𝑦=7, the 𝑥 and 𝑦 intercept are 7 and 3.5 respectively, thus the line crosses the𝑥−axis at the point (7,0) and the 𝑦−axis at the point (0,3.5). Therefore, the graph of equation 𝑥+2𝑦 =7, is a line passing through these points as shown in figure 6.14 below:
Exercise 5
1. Use the table of values to draw the graph of each of the following equations;
(a) 𝑦 = 3𝑥−8
(b) 𝑦 = 𝑥+6
(c) 4𝑥−2𝑦+7 = 0
(d) 2𝑥+5𝑦 =10
(e) 𝑥 = 𝑦
(f) 𝑥+𝑦 = 0
2. Use the intercepts to sketch the graph of each of the following equations;
(a) 𝑦 = 2𝑥+8
(b) 𝑦 = 𝑥−6
(c) 4𝑥−2𝑦+6 = 0
(d) 2𝑥+5𝑦 = 10
(e) 𝑥−6𝑦 =12
(f) 𝑥−2𝑦 = 4
3. Use the graph shown in figure 6.15 below to calculate;
(a) The gradient of the line (b) The y-intercept of the line (c) The x-intercept of the line.
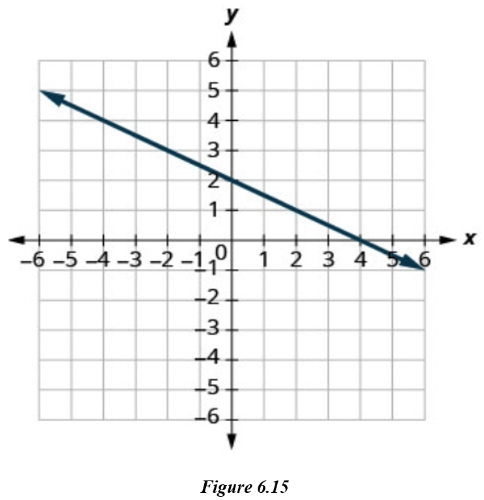
(d) From figure 6.15 above, find the equation of the line.
Solving Linear Simultaneous Equations Graphically
Solving linear simultaneous equations graphically is a method of finding the solution to two or more linear equations by drawing their graphs on the same coordinate plane and identifying the point where the lines intersect.
The Basic Ideas Behind the Graphs of Linear Equations in Solving Linear Simultaneous Equations Graphically and Use Graphs to Solve Linear Simultaneous Equations.
Explore the Basic Ideas Behind the Graphs of Linear Equations in Solving Linear Simultaneous Equations Graphically and Use Graphs to Solve Linear Simultaneous Equations.
Solving linear simultaneous equations graphically involves drawing or sketching the graph of each equation on the same 𝑥𝑦−𝑝𝑙𝑎𝑛𝑒. The point where the two lines cross each other is the solution to the given system of simultaneous equations.
Therefore, in solving linear simultaneous equations graphically, you need to follow the following simple procedures:
(1): Identify the system of simultaneous equations to be solved and separate the equations involved.
(2): Use the normal procedures to plot the graph of each equation on the same 𝑥𝑦−𝑝𝑙𝑎𝑛𝑒.
(3): From the graph, identify the point of intersection between the two plotted lines.
(4): Check if the point satisfies the given pair of equations.
(5): Make your conclusion.
Note that if your lines do not intersect or cross each other, then the system of equations has no solution. It is also important to note that the solution obtained by graphical method is not different from solutions obtained by using elimination or substitution methods.
Example 22
simultaneous equations by graphical Method

Solution;
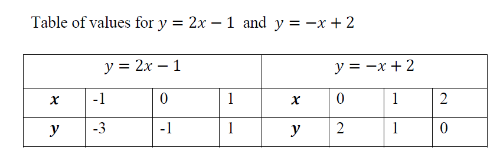
The graphs of the two equations are shown in figure 6.16 below;
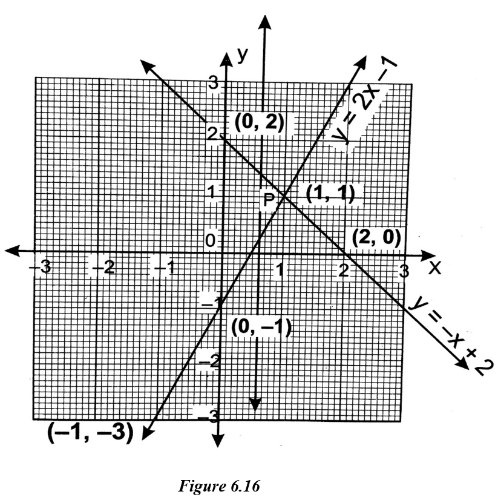
From the graph, we see that the two lines intersect at the P(1,1);
∴ 𝑥 = 𝟏 and 𝑦 = 𝟏.
Example 23
Find the solution to the following system of simultaneous equations graphically.
3𝑥+8𝑦 = 24 ............(i) and 𝑥+𝑦 =3 ..............(ii)
Solution;
The two equations can be written as 𝑦=−(3/8)𝑥+3 and 𝑦 =−𝑥+3 respectively.
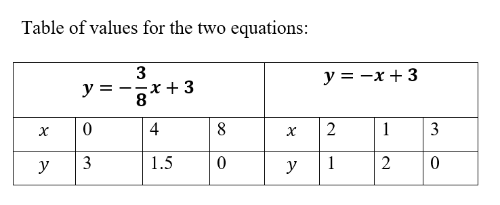
A graph representing the two equations is shown in figure 6.17 below;
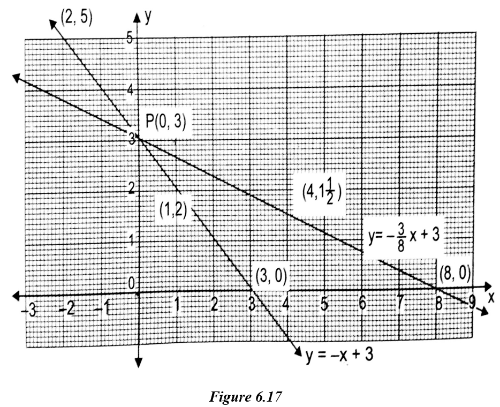
From the graph above, the two lines meet at the point P(0,3),
∴ The solution is 𝒙 = 𝟎 and 𝒚 = 𝟑.
NB: You can check the correctness of you answers by substituting the obtained values of the unknowns in the equations to see whether they are all satisfied or not.
Example 24
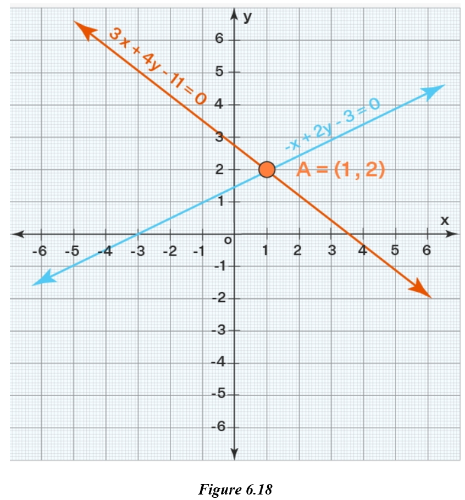
Figure 6.18 shows a graph of the equations 3𝑥+4𝑦−11= 0 and −𝑥+2𝑦−3 =0. Use the drawn graph to find the solution to this pair of equations;
Solution;
The figure above indicates that two lines meet at point A (1,2), so the solution to the system of equations, given by 3𝑥+4𝑦−11=0 and −𝑥+2𝑦−3 = 0 is the point (𝑥,𝑦) = (1,2).
Therefore, 𝐱 =𝟏 and 𝐲 = 𝟐.
Example 25
Solve the following simultaneous equations by graphically

Solution: The two equations can be written in the form of 𝑦 = 𝑚𝑥 + 𝑐 as
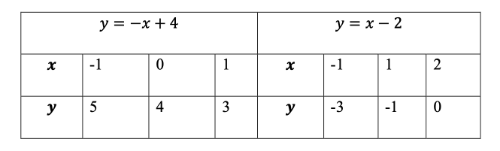
𝑦 = −𝑥 + 4 … … (𝑖) and 𝑦 = 𝑥 − 2 … … (𝑖𝑖) respectively.
Table of values for 𝑦 = −𝑥 + 4 and 𝑦 = 𝑥 − 2
A graph representing the two equations;
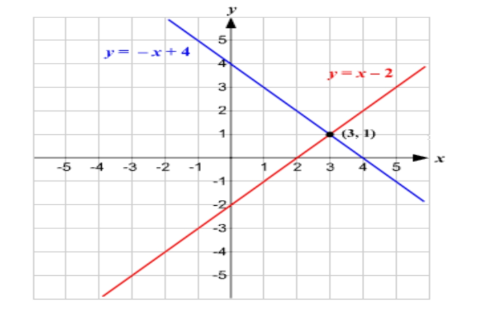
From the graph above, the two lines meet at the point (3, 1),
Therefore, the solution is 𝒙 = 𝟑 and 𝒚 = 𝟏.
Example 26
Solve the following simultaneous equations;

Solution;
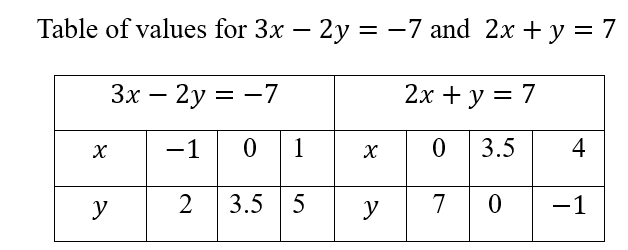
A graph representing the two equations is shown in figure 6.20 below;
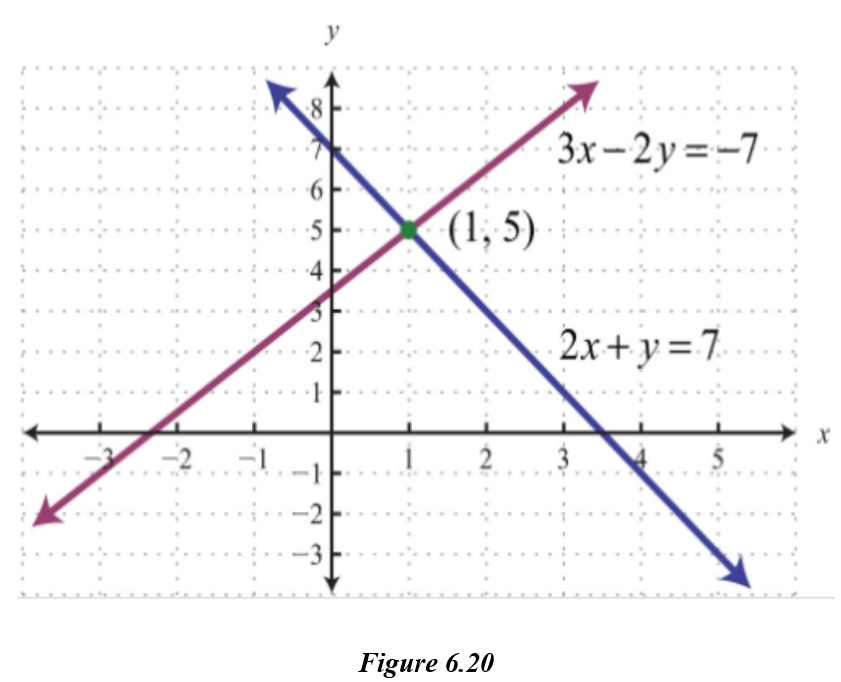
From the graph in figure 6.20, the two lines intersect at the point (1,5);
Therefore, the solution is 𝒙 = 𝟏 and 𝒚 = 𝟓.
Example 27
Use a graphical method to find the solution of the following simultaneous equations.
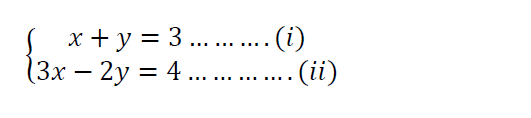
Solution;
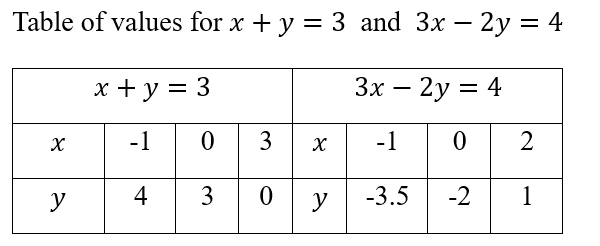
The equations are represented on a graph shown in figure 6.21 below;
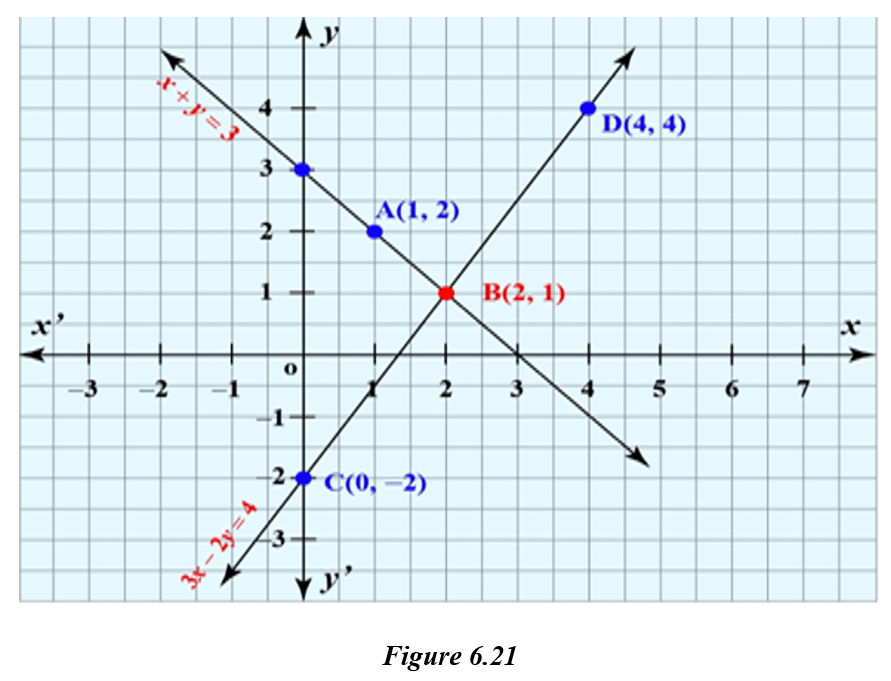
Figure 6.21 shows that the two lines intersect at point B(2,1),
∴ The solution is 𝑥 =2 and 𝑦 =1.
Exercise 6
1. Solve the following simultaneous equations with graphical method:

2. Two numbers are such that their average is 7, and when three is multiplied by the difference of a big number and small number gives 18. Find the numbers graphically.
3. John is thinking of two numbers. Two times the sum of the first and second numbers is 20, and half the first number is equal to twice the second number. Find the two numbers graphically.
Topic Summary
Coordinate Geometry (also called Analytical Geometry) is the study of geometry using a coordinate system, usually the Cartesian plane, where points are represented by ordered pairs (𝒙,𝒚). The topic combines algebra and geometry to solve geometric problems.
IMPORTANT HINTS
1. Cartesian Plane
A number plane sometimes called(𝑥𝑦−𝑝𝑙𝑎𝑛𝑒) or Cartesian Plane is made up of two number lines which intersect at right angles.
A horizontal line is called the x-axis and a vertical line y-axis.
The origin (0,0) is the point where the axes intersect.
A Cartesian plane is divided into four quadrants by a horizontal axis (x-axis) and a vertical axis (y-axis).
Quadrants are numbered I, II, III, IV in a counter-clockwise direction
2. Points in the Plane
A point is represented as (𝒙,𝒚), where: 𝒙 = distance from y-axis (horizontal movement) and 𝒚 = distance from x-axis (vertical movement)
A Point can lie in any quadrant or on the axes.
3. Plotting Points
(i) Start from the origin.
(ii) Move x units along the x-axis, then y units along the y-axis.
(iii) Mark the point as (𝒙,𝒚).
4. Slope of a Line (m).
The Slope or Gradient of a line normally represented by letter m, is defined as the ratio of change in y to change in x.

5. Equation of a Line
(i) Point-slope form: 𝒚−𝒚𝟏=𝒎(𝒙−𝒙𝟏)
(ii) Slope-intercept form: 𝒚=𝒎𝒙+𝒄, where 𝒄 is the y-intercept.
(iii) General equation form: 𝑎𝑥+𝑏𝑦+𝑐=0, where 𝑎 and 𝑏 are the coefficients of 𝑥 and 𝑦 respectively.
6. Intercepts
(i) X-intercept: The line meets x-axis (𝒚=𝟎), its corresponding point is in the form of (x,0).
(ii) Y-intercept:The line meets y-axis (𝒙=𝟎), its corresponding point is in the form of (0,y).
7. Graphing Linear Equations
Use table of values or (x- and y-intercepts) to plot straight lines. A graph can be plotted by connecting two points on the plane.
Listening to this topic